Computes the logistic (i.e., sigmoid) function with configurable slope, midpoint, and upper asymptote.
Usage
logistic(x, slope = 1, midpoint = 0, upper = 1)

sigmoid(x, slope = 1, midpoint = 0, upper = 1)Details
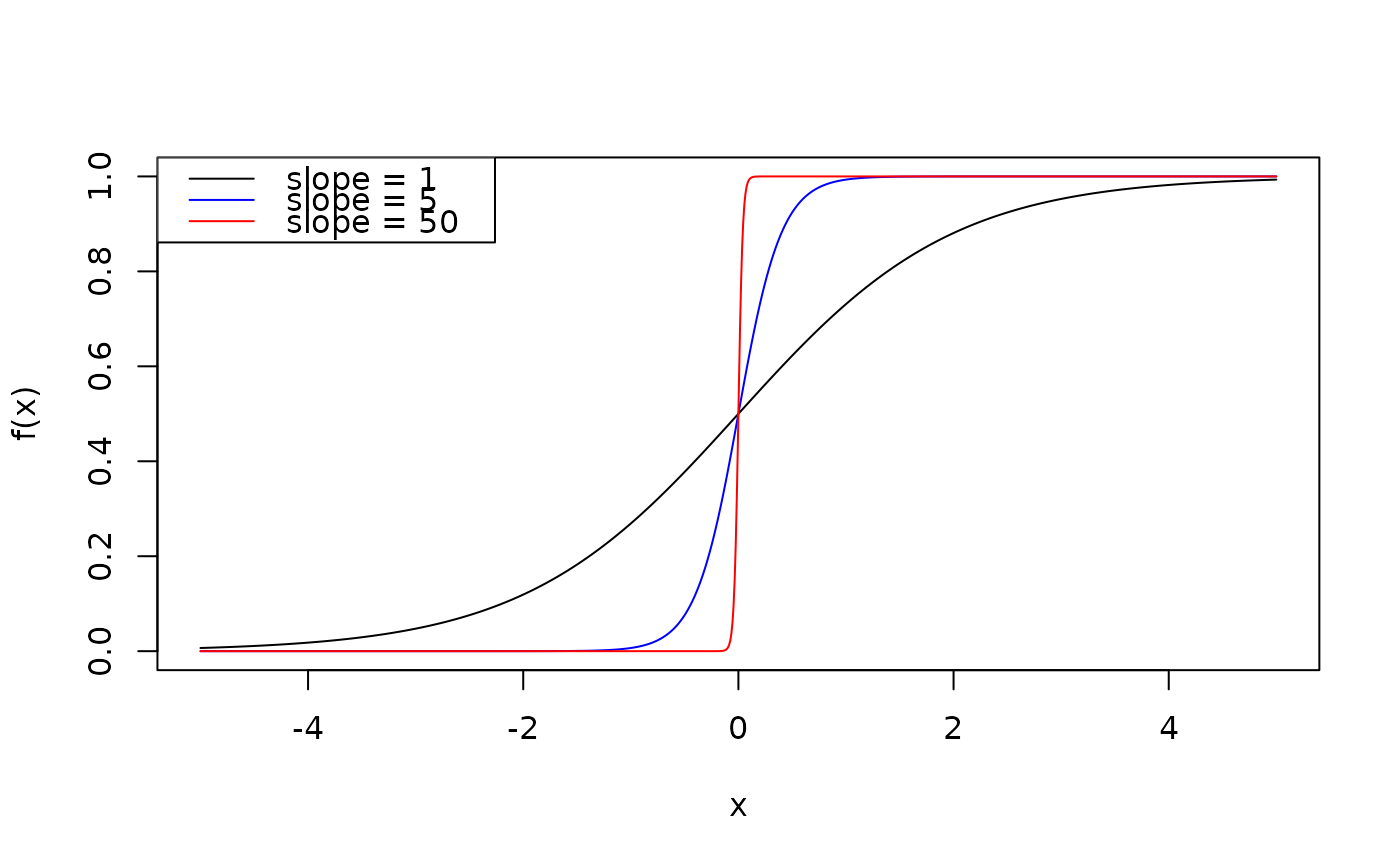
The logistic function is a smooth S-shaped curve bounded between 0 and upper.
It transitions from near 0 to near upper around the midpoint, with the steepness
of this transition controlled by slope.
Examples
logistic(0)
#> [1] 0.5
# equivalent:
sigmoid(0)
#> [1] 0.5

# Adjust parameters
logistic(0, slope = 5, midpoint = 0.5, upper = 10)
#> [1] 0.7585818

# Visualize different slopes
curve(logistic(x, slope = 1), from = -5, to = 5, ylab = "f(x)", ylim = c(0, 1))
curve(logistic(x, slope = 5), add = TRUE, col = "blue")
curve(logistic(x, slope = 50), add = TRUE, col = "red")
legend("topleft",
  legend = c("slope = 1", "slope = 5", "slope = 50"),
  col = c("black", "blue", "red"), lty = 1
)